By S. Guraziu, May 2020
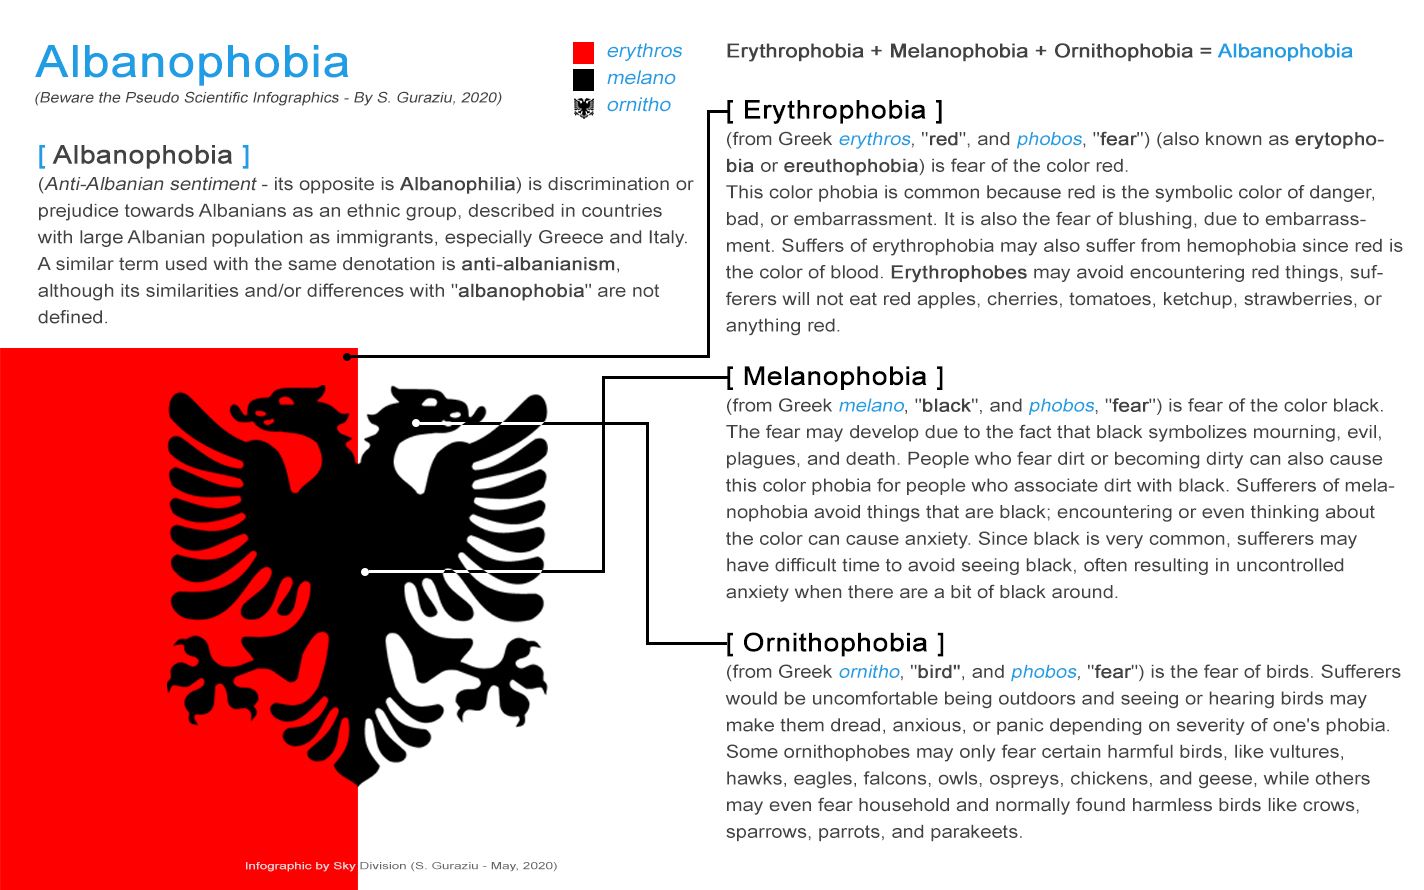
[ constructing a false hypothesis – Erythrophobia + Melanophobia + Ornithophobia = Albanophobia
graphically, I can defend my conspirative hypothesis before any academic “cathedral”, visually I can whisper in your “eyes”, my whisper will amuse your “ears” and your brain 🙂 ]
“…the lines between fact and fiction, between a factual document and forgery, between ‘truth’ and ‘falsehood’ – have never been so ‘slippery’ and difficult to discover. Manipulation of information and of images on the Internet, especially through social media and digital media in general, is being used in unprecedented ways to distort our perception of the world (and its impact on politics). Digital “world” is influencing the (real) physical world at a rate of accelerated “craziness” – as well as in other ways, we may not even be able to understand. ” – (Jake Rowland – Wired, 2018)
***
Since images are able to grab our attention easily, we are immediately drawn to them. Experts claim that the use of imagery in infographics can aid not only to comprehension and aesthetic appeal, but is also involved in forming visual memories, thus reinforcing the process of memory recall as well. Additionally, the use of visual elements that adhere to the stylistic personality of the infographic, can increase this effect.
Visuals are always more effective than just the written word, this is known since the prehistory perhaps. According to “BiomedCentral” a large percentage of the human brain dedicates itself to visual processing, our love of images lies with our cognition and ability to pay attention.
And also, according to “Science Daily”, a new research shows how visual attention affects activity in specific brain cells, the study shows that attention increases the efficiency of signaling into the brain’s cerebral cortex and boosts the ratio of signal over noise.
Today, this strong fact (about the brain and visuals) is used so efficiently for marketing purposes. According to “RetoolMarketing” an image is more colorful than a group of words, literally and figuratively. People tend to look at compelling visuals. Our attention is more readily attracted to a picture rather than simply a group of words.
Infographics make information visible, that’s their “goal”, infographics tell a story visually that is easy to understand, grab the reader’s attention, and spark further interests. Of course, since the Art (as a big “branch”) “uses” this power itself. We know, for instance an artist, or a photographer is always trying to evoke an emotion – a genuine feeling in the viewers that connects them to the picture, to the photograph. Any artist wants the viewers to mentally put themselves in the “picture”, or at least, feel like they are in the same space as they view it.
Lets say, the motive of all marketing purposes is easy to undertsand, but in the case of complex “themas”, especially in today’s turbulent world, having in our disposal such powerful tools (ie. Internet, iPhones, thousand of social media outlets etc.), so many things are being constantly served to us with the speed of light. Unfortunately, we often fail to identify the issue or topic presented and the author’s purpose or claim.
Yesterday someone showed me some infographics, american infographics (which, in terms of visual appeal, are always stuning, americans are well known for their beautiful “symbolism”, they can design logos, seals and so forth, better than “anybody”, they know very well how important it is, for example their Presidential Seal is the most beautiful seal in the universe). “Graphically” gifted people can construct visually anything, often mixing known facts (numbers, scientific data, diagrams etc.) with false hypotheses and, in many cases with “conspirational theories”.
I could tell him “beware the pseudo scientific infographics, presenting psedo-info and making it beautiful has never been easier”. I even could show him visually, graphically, practically, how easy it is! For this specific purpose I used “albanophobia”… and some scientific terms to explain the “truth theory”. Graphically, I can defend my conspirative hypothesis before any academic “cathedral”, visually I can whisper in your “eyes”, my conspiratorial whisper will amuse your “ears” and your brain 🙂
Appendix:
Wired magazine, since 2018 has published an article (a very long one), I really recommend it… for anyone to read, since it’s an investigative article, feed with facts, even though, like I said it will “eat” some of your time, it’s a crazy loooooong article…
Inside the Two Years That Shook Facebook – and the World
(How a confused, defensive social media giant steered itself into a disaster…)